- Print
- DarkLight
Article summary
Did you find this summary helpful?
Thank you for your feedback!
Forecast & Pacing
The Forecast & Pacing dashboard provides a detailed view of the projected revenue and the pacing of sales performance. This dashboard helps you compare actual sales data with forecasted values to track whether your business is on pace to meet its revenue goals. By leveraging these metrics, you can make informed decisions and adjust your strategy to stay on target.
| Metric | Definition |
|---|---|
| Gross Sales ($) | Total revenue generated from the sale of goods or services, calculated before any deductions such as returns, discounts, or allowances. |
| Open Orders ($) | The cumulative value of orders that have been placed by customers but have not yet been fulfilled or processed for shipment. |
| Forecast Rev ($) | The projected revenue from sales, based on forecasts. If the forecast period extends beyond the last recorded sales data, the system will calculate the expected revenue for that period. |
| Projection ($) | An estimated value for future performance, typically used in financial planning to predict potential outcomes based on available data and trends. |
| % Pacing | A metric that compares actual performance against the forecasted or planned performance. It helps to evaluate if the business is on track to meet its goals within a given timeframe. |
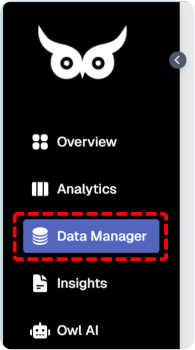
If you want to see more detailed definitions and calculations for each metric, you can find this information in the Data Manager section within the platform.


