- Print
- DarkLight
A Cornerstone of Effective Demand Planning
Forecastability analysis is a critical process in modern supply chain management, focusing on assessing the inherent predictability of demand for different products or product groups. This analysis goes beyond simply generating forecasts; it helps companies understand which products are easily predictable and which pose significant challenges. By identifying these patterns, businesses can optimize resource allocation, tailor forecasting methods, and ultimately improve their bottom line.
Why is Forecastability Analysis Essential?
In today's dynamic market, accurate demand forecasting is crucial for maintaining a competitive edge. However, not all products exhibit the same level of predictability. Forecastability analysis addresses this by:
Prioritizing Efforts: It helps businesses focus their limited forecasting resources on the most critical products.
Optimizing Forecasting Methods: By understanding the level of predictability, companies can select the most appropriate forecasting techniques. For highly predictable products, statistical models may suffice. Conversely, products with high uncertainty may require a combination of statistical forecasting and market intelligence (e.g., customer surveys, competitive analysis, economic indicators).
Improving Decision-Making: Forecastability analysis informs key decisions such as:
Forecast Hierarchy: Determining the appropriate level of detail for forecasting (e.g., product level, product family level).
Forecast Horizon: Selecting the appropriate time frame for forecasts (e.g., weekly, monthly, quarterly).
Inventory Management: Implementing appropriate inventory policies for different product categories.
The Forecastability Analysis Process
There are 3 essential steps to a good Forecastability Analysis.
1. Demand History Analysis:
- Data Collection and Segmentation: Gather historical sales data for each product and segment products based on their relative value to the business.
- Demand Pattern Identification: Analyze historical data to identify key demand patterns such as seasonality, trends, and anomalies.
- Product Classification: Categorize products based on their demand history:
New: Insufficient historical data for reliable forecasting.
Emerging: Sufficient data for forecasting but limited ability to detect seasonality.
Mature: Stable demand with clear historical patterns.
Sporadic: High percentage of historical values are zero.
Obsolete: No recent sales history.
2.Selecting a Forecast Strategy
- Method Evaluation: Evaluate the accuracy of various forecasting methods, including statistical (e.g., ARIMA, exponential smoothing) and non-statistical (e.g., judgmental forecasting, market research) approaches.
- Product Hierarchy and Time Granularity: Determine the optimal level of product detail and time horizon for forecasting.
- Promotion and Event Modeling: Incorporate the impact of promotions, events, and other external factors into the forecasting process.
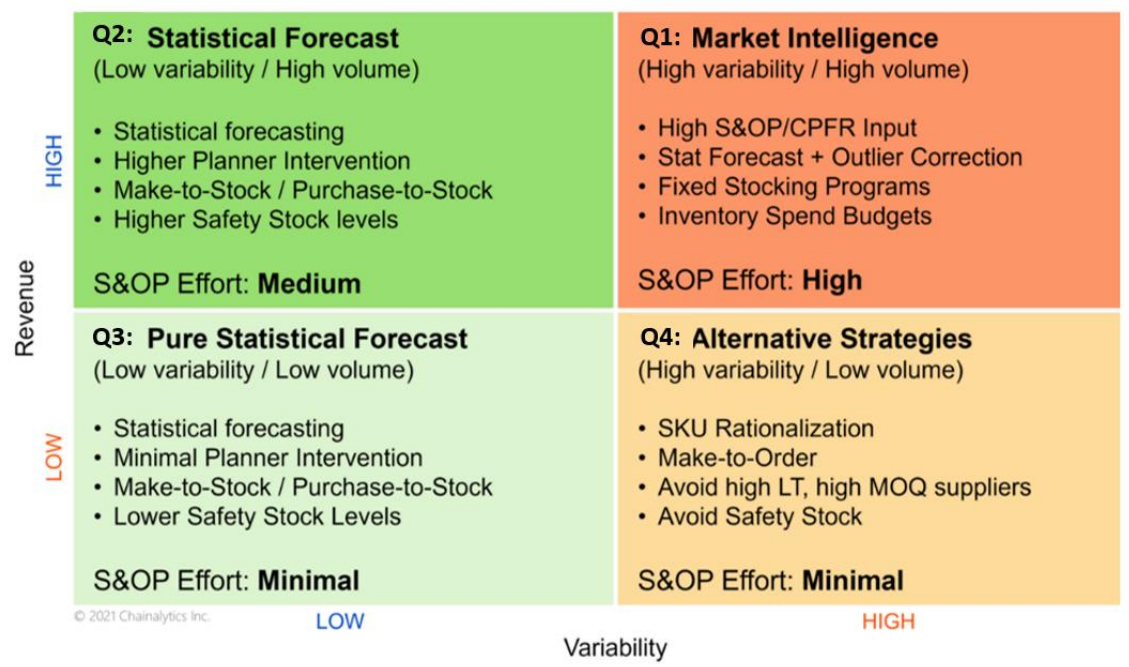
3. Quadrant Analysis
Product Categorization: Group products into four quadrants based on their:
Forecastability: How easily demand can be predicted.
Impact: The potential impact of forecast errors on the business.Policy Development: Develop specific policies for each quadrant:
High Impact, High Forecastability: Focus on accurate statistical forecasting and automated exception monitoring.
High Impact, Low Forecastability: Combine statistical forecasting with market intelligence and implement robust risk management strategies.
Low Impact, High Forecastability: Utilize simple forecasting methods and focus on efficient inventory management.
Low Impact, Low Forecastability: Implement agile inventory strategies and minimize forecasting efforts.

Conclusion
For products with high forecastability: The conclusion states that these products should have a strong focus on accurate statistical forecasting and automated exception monitoring. This implies the use of automated forecasting systems and regular review by responsible staff to identify and address any deviations from expected patterns.
For products with low forecastability: The conclusion suggests that these products may benefit more from agile inventory strategies and minimized forecasting efforts. This is because accurate forecasting may be challenging or costly for these products, and focusing on quick response to actual demand fluctuations might be more effective.


