- Print
- DarkLight
A Deep Dive into Forecastability and Accuracy
In the dynamic world of supply chain management, achieving accurate demand forecasts is no longer merely a desirable goal; it has become a critical determinant of success. Organizations that effectively predict and plan for customer demand gain a significant competitive advantage. However, the inherent variability of demand for many products presents a persistent challenge. This article delves into the core concept of forecastability, exploring its key drivers, implications, and strategies for enhancing forecast accuracy.
Understanding Forecastability
Forecasting typically involves gathering historical data, applying forecasting models, and predicting future demand. However, the reliability of this process depends heavily on the nature of the product’s demand pattern. Some products have predictable, stable demand, while others show high variability, making accurate forecasting much more difficult.
Forecastability, at its essence, quantifies the degree to which future demand for a product can be reliably predicted. It's a measure of how confidently we can anticipate customer behavior and translate it into accurate demand projections.
Key Drivers of Forecastability
Several factors significantly influence the forecastability of a product's demand. Two key metrics provide invaluable insights into these drivers:
• Average Demand Interval (ADI)
This metric measures the regularity of demand over time. It quantifies the average time elapsed between two consecutive customer orders or demands for a specific product. A low ADI suggests frequent and consistent demand, while a high ADI indicates infrequent and sporadic demand. For instance, a product with a low ADI might be a daily essential, whereas a high ADI might characterize a seasonal product or a spare part for specialized equipment.
• Coefficient of Variation (CV²)
This metric assesses the variability in demand quantities. It measures the degree of fluctuation in the volume of demand from one period to another. A high CV² signifies substantial fluctuations in demand, making accurate predictions more challenging. For example, a product with high CV² might experience significant fluctuations in sales volume due to promotional activities, competitor actions, or unpredictable events.
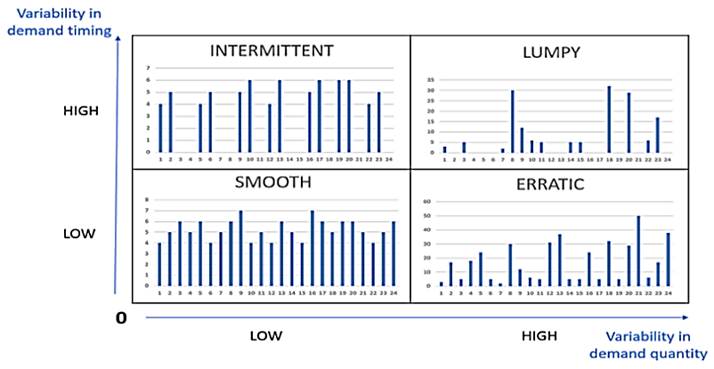
Together, these two coefficients help us classify demand profiles into four distinct categories, which influence forecasting methods and accuracy.
Parameters calculation
• The Average Demand Interval (ADI): It measures the demand regularity in time by computing the average interval between two demands.
![]()
Ti: Period between two consecutive demand periods
N: Number of all demand periods.
• The Square of the Coefficient of Variation (CV²): It measures the variation in quantities.

The threshold values of ADI and CV² are 1.32 and 0.49, respectively
Based on the values of ADI and CV², demand patterns can be categorized into four distinct categories, each with unique forecasting challenges and implications:

• Smooth:
ADI < 1.32 & CV² < 0.49
Characterized by consistent demand both in timing (ADI) and quantity (CV²).
Exhibits a steady and predictable flow of demand over time.
Examples: Everyday consumables (milk, bread), staple foods, utilities.
Forecasting Ease: Relatively easy to forecast due to its consistent and predictable nature. Simple forecasting methods like moving averages or exponential smoothing can often provide accurate results.
• Intermittent:
ADI >= 1.32 and CV² < 0.49
Irregular timing of demand (high ADI) but with consistent quantities when demand occurs (low CV²).
Experiences infrequent orders with relatively stable order sizes.
Examples: Spare parts for industrial equipment, seasonal products with predictable demand volumes during specific periods.
Forecasting Ease: Moderate difficulty. Forecasting methods that account for the irregular timing of demand, such as Croston's method or the intermittent demand model, are often necessary.
• Erratic:
ADI < 1.32 and CV² >= 0.49
Regular timing of demand (low ADI) but with significant fluctuations in demand quantity (high CV²).
Experiences frequent orders but with highly variable order sizes.
Examples: Fashion items, high-tech gadgets subject to rapid technological advancements or short product lifecycles.
Forecasting Ease: Difficult to forecast due to the unpredictable nature of demand volumes. Sophisticated forecasting methods, such as machine learning algorithms or simulation models, may be required.
• Lumpy:
ADI >= 1.32 and CV² >= 0.49
Exhibits both irregular timing (high ADI) and high variability in demand quantity (high CV²).
Characterized by infrequent orders with large and unpredictable order sizes.
Examples: Large capital equipment, project-based services, and some types of emergency supplies.
Forecasting Ease: Very difficult to forecast accurately. These products often require significant safety stock to mitigate the risk of stockouts due to their unpredictable nature.
Implications for Forecasting Accuracy
Accurate forecasting is crucial for:
- Optimizing inventory levels: Avoiding stockouts while minimizing excess inventory.
- Improving production planning: Ensuring timely and efficient production to meet demand.
- Making informed business decisions: Supporting strategic planning and resource allocation.
However, the accuracy of forecasts is directly linked to the forecastability of the product. Products with smooth demand patterns are generally easier to forecast accurately, while erratic and lumpy demand patterns pose significant challenges.
Strategies for Improving Forecast Accuracy
- Select appropriate forecasting methods: Utilize forecasting techniques that are suitable for the specific demand pattern, such as exponential smoothing for smooth demand and more sophisticated methods for erratic demand.
- Utilize historical data effectively: Analyze historical demand data to identify trends, seasonality, and other patterns.
- Incorporate external factors: Consider external factors that may influence demand, such as economic conditions, competitor activities, and market trends.
- Regularly review and refine forecasts: Continuously monitor forecast performance and adjust forecasting methods as needed based on actual demand.
Conclusion
Understanding the concept of forecastability is crucial for effective demand planning. By accurately classifying demand patterns and selecting appropriate forecasting methods, businesses can improve the accuracy of their forecasts, optimize their supply chains, and ultimately gain a competitive advantage.


